


Billion Dollar Disasters on the Rise Due to Climate Change
Don’t let anyone tell you differently.


Photo by Kelly Sikkema on Unsplash
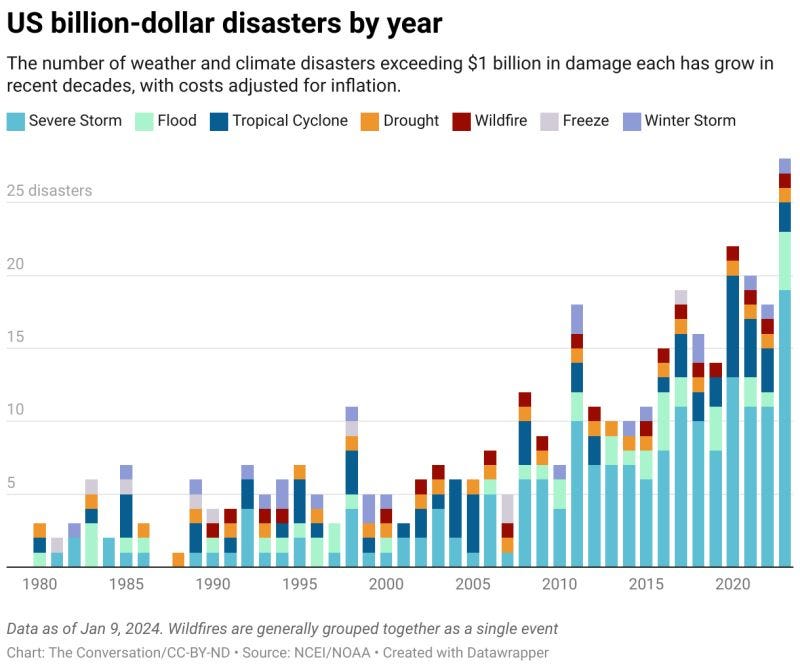
The National Oceanic and Atmospheric Administration (NOAA) National Centers for Environmental Information (NCEI) released its 2023 Billion-Dollar Weather and Climate Disasters report in early 2024. According to the report, there were 28 billion-dollar disasters in 2023 (up from 18 the previous year). The former high mark was 2020 when there were 22 billion-dollar disasters. The total cost for these 28 disasters was $92.9 billion, but that might rise by billions of dollars when the costs of the December 2023, East Coast storm and flooding event are included.
The total cost of U.S. billion-dollar disasters over the previous 5 years (2018-2022) was $600 billion, an average of about $120 billion per year. To put this in perspective, that $120 billion number is more than double the inflation-adjusted annual average cost per year ($57.7 billion) for the past 43 years. This $120 million number per year is also conservative. The report only looks at billion-dollar disasters, so there are plenty of tens of millions of dollars and hundreds of million-dollar disasters not accounted for by the NOAA report.
As the pace of climate change intensifies, we can expect that $120 billion per year number to double again over the next 20 – 40 years, or maybe go even higher. All those damages come out of our pockets somehow; either from direct effects on us, inflation from scarcity of goods and services destroyed by these disasters, or higher taxes to pay for the reconstruction of more and more of our infrastructure being destroyed each year.
Billion-dollar disasters are fu***** expensive. In most cases, we look to rebuild what was destroyed or fix what was damaged. Check out the chart below to see how expensive this is getting.
A rebuttal
I posted that graphic on my Substack on Friday and posted it on LinkedIn, and got a note on my LinkedIn from Roger Pielke Jr. suggesting I look at his recent Substack. You can see it at, Global Disaster Losses: 1990-2023 - by Roger Pielke Jr. (substack.com).
So I did. Pielke suggests that we consider the United Nations Sendai Framework for Disaster Risk Reduction, which identifies disaster losses as a proportion of GDP. He says that this makes sense because as the global economy grows there is more “stuff” exposed and vulnerable to being damaged.
This makes some sense. But not a lot of sense.
I’m not picking on Roger. He’s a professor at the University of Colorado, so there is a good chance he is smarter than me. I just disagree with him on this one point. But read his stuff and decide for yourself.
My reply
Why should we normalize disaster data against GPD? The US economy is mostly made up of services. Such is the case with most other developed nations, whose economies are largely service based.
Service-based industries, including professional and business services, real estate, finance, and health care, make up the bulk (70%) of U.S. GDP. In comparison, goods-producing industries like agriculture, manufacturing, mining, and construction play a smaller role.
Look at that graphic again. In 1980 there were 3 billion dollar damage events. In 2023 there were 28. That is an increase of over 9 times. Did GDP go up 9 times since 1980? No, it did not.
I asked the Internet about the average growth of GDP in the US from 1980 to 2024. The answer was about 2.5%. At that rate, it would take about 35 years for the size of the US economy as measured by GDP to double. By that math, the US economy doubled (from 1980) around the year 2015. That number will double again by about 2050, assuming an average 2.5% growth rate. GDP will not have grown the 9 times that our billion-dollar disaster data did, until well past 2100. Do the math for yourself, I’ll wait.
The pace of billion-dollar disasters is far outpacing GDP growth. We didn’t have 9 times the billion-dollar disasters in the US than we did in 1980 because we have more stuff. We had nine times the billion-dollar disaster because we have undertaken a pretty irresponsible science experiment, and we are being pummeled by more climate-related disasters. There were no severe storm billion-dollar damages in 1980, and few in the following years. Fast forward to the last few years, and severe weather dominates the damage chart. That isn’t a coincidence. The atmosphere is loaded with carbon dioxide. In 1980, the CO2 concentration in the atmosphere was 339 parts per million (ppm). Today we are at about 420 ppm. That is a 24 percent increase. The giant uptick in billion-dollar disasters isn’t inflation or simply having more stuff. It is climate change.
Anyone looking to normalize billion-dollar disaster numbers against GDP is trying to tell you that things are fine.
Things are not fine.
This is a degrowth blog. We don’t want GDP to grown anyway.
Most of the United States economy was service oriented from 1980 – 2023. A law firm, accounting firm, investment firm, medical practice, and the hundreds of millions of service professionals over that time likely NEVER had a billion-dollar damage event. Those billion-dollar damage events are to physical infrastructure, buildings destroyed, forests burned, flood damage, drought damage, and so on. Sure a law office might have gotten damaged here or there, but the value of that firm, as with most service firms, is in people’s heads. Physical plant and equipment that gets destroyed need to be replaced. Did the level of physical infrastructure in the United States – which was increasingly becoming service-oriented – increase nearly 9 times in size from 1980 - 2023?
No, it did not.
Look at any city in the US. Did they increase nearly nine times in size from 1980 to 2023? No, they did not. Do those places have 9 times the stuff that they did in 1980? No, they do not. They certainly grew, and it is correct to assume that some of the increase in damage over the years came from an increase in the size of property, plant, and equipment under threat of extreme weather events. But to just slough off the NOAA report and say, “The economy was bigger and that’s why we have more damage,” is dangerously dismissive of the environmental factors at play here.
If the US economy follows a degrowth path tomorrow and GDP slowly shrinks until 2030, you can expect the numbers in future NOAA reports to still go up, because the climate bomb we have created is already active and will continue to be so unless and until there are drastic removal of CO2 from the atmosphere.
To understand the numbers in the NOAA report, understand the physics that caused these problems (climate change), not economics. The laws of physics aren’t negotiable. Be wary when people tell you otherwise.
Thanks Mark. I think measuring it a couple different ways and presenting each would tell a fuller story. Number of billion dollar damages is one, but I'd also like metrics on how this impacts people. Things such as updated flood maps with climate science baked in, same for fire risk, etc. https://firststreet.org/ is starting to do some of that.
Thanks for this, the point you make about GDP not being the ideal metric to normalise against is a good one. 👏Something had been nawing away at me about this too.
Property value could be another one?